44
$\begingroup$

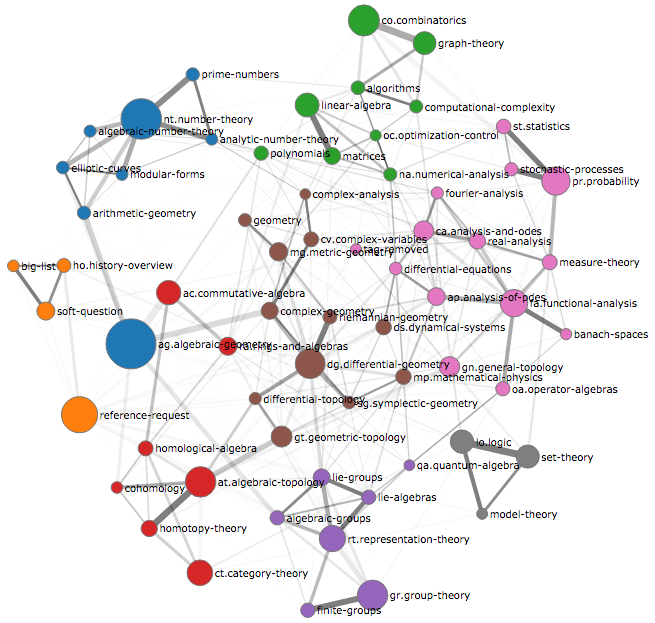
I created a graph of tags from Stack Exchange sites (including MathOverflow), TagOverflow.

It is a continuation on my previous project - plots with static graphs and (sadly) without MO (due to API differences - i.e. lack of such for MO at this time).

Nodes represent the most popular tags, with their area being proportional to the number of questions with them.

Edges represent relation between tags. Their width is related to the number of questions with both tags, while their shade - how much more often they occur than one should expect by random chance.

Default coloring is due to community detection - automated splitting of a graph into densely connected subgraphs. Positions of the nodes are due to D3.js force layout. That is, nodes connected via an edge attract each other. The strength of such attraction depends on the strength of an edge. Plus, all nodes repeal each other at a short distance to prevent overlaps.

Code and description is on GitHub.

Besides looking at the graph, you can:

  • get interesting information per tag (e.g. top questions and users),
  • get some statistics (like average score for these tags).

I hope you enjoy it!

Also, if you have comments how to improve its usefulness or niceness to our community, I would appreciate them. And if you get any insights from this tool, I would be happy if you could share them.
enter image description here

$\endgroup$
22
  • 4
    $\begingroup$ Much as I appreciate such projects, I would like this to have a question format. A good question would be "where do I announce such things, and how?" Since you have already done that here, I recommend the next question "What improvements would you suggest for this particular project?" My worry is that people will think of MathOverflow meta as a good place to announce their cool project; meta is NOT such a place. A good place would be a user page, and I can see meta being used to have as answer such posts as your above. Gerhard "Does It Make MathOverflow Numbers?" Paseman, 2015.02.12 $\endgroup$ Commented Feb 12, 2015 at 20:31
  • 1
    $\begingroup$ By the way, to be friendly to users who are color challenged, you might add a mark to each similarly colored circle, perhaps a clock-tick, so that such people who like color-coding can read it off the mark (or maybe use a chord). Gerhard "Make Such Graphs More Accessible" Paseman, 2015.02.12 $\endgroup$ Commented Feb 12, 2015 at 20:36
  • 10
    $\begingroup$ @GerhardPaseman Ad 1 I am aware of it, yet consider it beneficial & interesting for the community; if the community disagrees, there are down and close votes. Ad 2 code is on GitHub, feel invited to Fork or Pull Request with such improvements. In any case, for community detection is an derivate thing, making it simpler to see groupings (at least to some). $\endgroup$ Commented Feb 12, 2015 at 21:38
  • $\begingroup$ How is the node placement determined? It seems that this is the main information a viewer extracts from the graph, so it would be nice to know what it means. $\endgroup$ Commented Feb 12, 2015 at 23:23
  • 2
    $\begingroup$ The "tag-removed" made me smile, don't ask why. :) $\endgroup$
    – Hachino
    Commented Feb 13, 2015 at 7:59
  • $\begingroup$ @ScottMorrison Added in the description. In short: a spring model. $\endgroup$ Commented Feb 13, 2015 at 10:57
  • 3
    $\begingroup$ Can you try to detect "cliques of friends"? AFAICT voting is not in the database, but answering/commenting might be of help. $\endgroup$
    – joro
    Commented Feb 13, 2015 at 12:55
  • $\begingroup$ @joro It's certainly possible but a different project (if you want to do it, I would be happy to help - just mail me). With JSON API it is possible to do some of it, but the best way to go is via data.stackexchange.com. In any case, you need to define measure of interaction -> and later community detection like Louvain or (better) Infomap (see README.md of the project on GitHub). $\endgroup$ Commented Feb 13, 2015 at 15:19
  • $\begingroup$ Absolutely wonderful! One question: although on the image here you have more tags than what I see when I follow your link, there is the tag nt.number-theory which is not on your image. And that tag there is moreover not connected to any other tags. Does it mean number theory is sort of an isolated topic at MO?? $\endgroup$ Commented Feb 14, 2015 at 20:51
  • 4
    $\begingroup$ It would be interesting to compare this graph to some measure of (international) professional activity in each subfield, e.g., papers published, # of researchers who identify with subfields, etc. In other words, how representative is the MO weight of ag.algebraic-geometry, etc.? $\endgroup$ Commented Feb 15, 2015 at 3:36
  • 1
    $\begingroup$ @მამუკაჯიბლაძე Fortune favours the bold! (You can get blocked anyway, with more of smaller queries; but it lasts for a few minutes, not - your lifetime.) $\endgroup$ Commented Feb 15, 2015 at 10:49
  • 1
    $\begingroup$ @PiotrMigdal: Not sure this will help, but: arXiv statistics. $\endgroup$ Commented Feb 15, 2015 at 18:58
  • 1
    $\begingroup$ @JosephO'Rourke It is possible - see academia.stackexchange.com/questions/38969/…. $\endgroup$ Commented Feb 16, 2015 at 21:08
  • 3
    $\begingroup$ @Name Link: stared.github.io/tagoverflow/?site=mathoverflow.net&size=32 $\endgroup$ Commented Feb 20, 2015 at 11:03
  • 2
    $\begingroup$ This is the sort of thing that tea.mathoverflow.net would be well suited for, if it were not derelict. $\endgroup$ Commented Feb 20, 2015 at 16:48

0

You must log in to answer this question.

Browse other questions tagged .