I do not really have an answer, but let me at least provide some further SEDE queries, so that we have more data. (I only know very basics of SQL, but I hope that somebody more knowledgeable might have a look and spot if I made some mistakes in the queries. I have checked at least some of the numbers here in chat.)
I have linked to queries for MO below, you can switch to other sites if you want to compare the statistics.
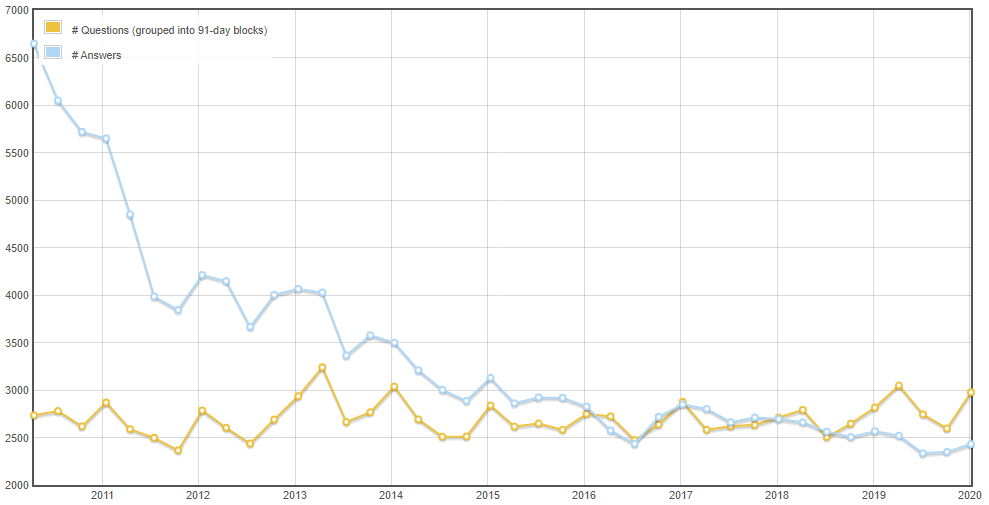
For the sake of simplicity, I am grouping the data by month. (In this way we're comparing months with different number of days, but probably this difference is not that significant, especially considering some seasonal changes such as Christmas or academic year which might have bigger effect.) Here is the number of questions/answers/all posts per month (and a corresponding query which includes deleted posts).
We can compare this with other statistics about the site:
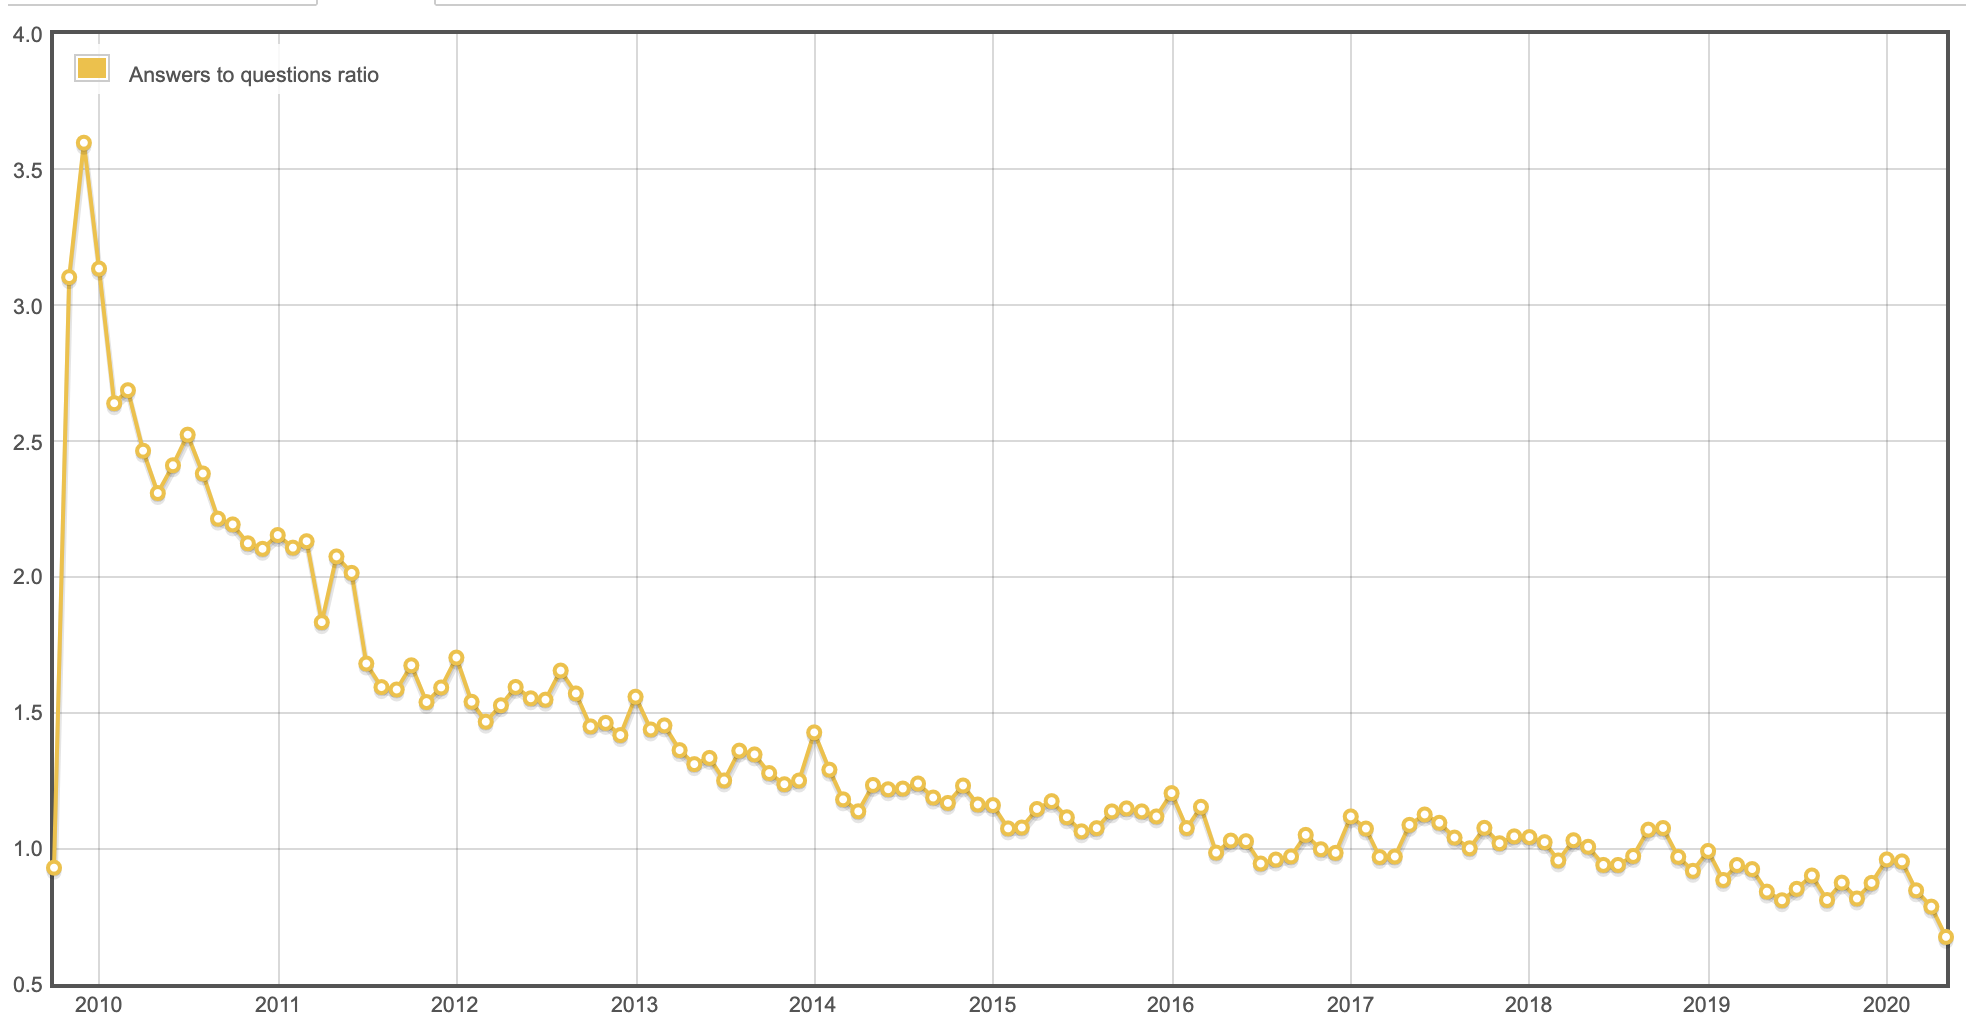
- We can look at the ratio of answers posted to questions posted (and the same query including deleted posts).
- We can compare this with number of active users. Since number of users who visited the site is not available in SEDE, we can try to use users who made at least one post or users who made at least one comment as a proxy. Depending on which of the two measures we take, we get this number of posts/questions/answers per active user: query 1 - posts, query 2 - comments.
- Another statistical datapoint available is number of views of the questions. It is expected that older questions have more views, since they had more time to accumulate them, here is the corresponding graph. We can ask how the number of answers per one view evolves depending on the age of the question, we get this query. (Although it is probably expected that after certain time the questions are more likely to get new views than new answers, so the data from here do not have a straightforward interpretation.)
- This query returns average answerscount (depending on the age of the question).
- If we are looking at number of answers, perhaps also number of unanswered questions (=questions with no answers) might be of interest. Here is number and percentage of such questions depending on month when the question was posted.
In the question (and the comments here and here) it was suggested that we could measure also number of answers and total score of all answers combined.
- In this query you can see how numbers of upvotes cast on questions/answers/all posts evolves over time. (This query takes into consideration the date when the vote was cast, rather than the date when the question was posted.)
- Here is a query which calculates average "total score of all answers" (i.e., sum all scores of the answers) depending on month when the question was posted. (In case this "total answer score" seems interesting to you, here is a query that can be used to get it for individual questions.
It was pointed out by Will Sawin that at the beginnings of MO there were more big-list questions, which might influence the number of answers. We might check for these by looking at some specific tags, or by taking into account only non-CW posts. (Originally I used in tag-related queries simply the AnswerCount, which meant that an answer was counted in the month when the question was posted. I reworked the queries since then, in the queries where this is applicable the answers should be counted based on the date when the answer was posted.)
- The fact that number of CW posts is now lower can be confirmed by this query. Queries for non-CW posts: number of posts, answers to questions ratio, answers per user, answers per view, numbers of upvotes and average sum of answer-scores.
- We can see that the tags big-list and soft-questions have now less posts from this graph. If we exclude these tags we get: number of posts,
answers to questions ratio,
answers per view,
answers per user,
and average sum of answer-scores.
- Since we're using at some particular tags, some users might be interested in stats about their favorite tags. You can check the following queries and change the parameter tagname to various tags: number of posts,
answers to questions ratio,
answers per user,
answers per view,
number of upvotes
and average sum of answer-scores.
Probably at least in some of the queries above some changes over time are to be expected - for example, older questions (and their answers) had longer time for getting upvotes, views, etc.


