11
$\begingroup$

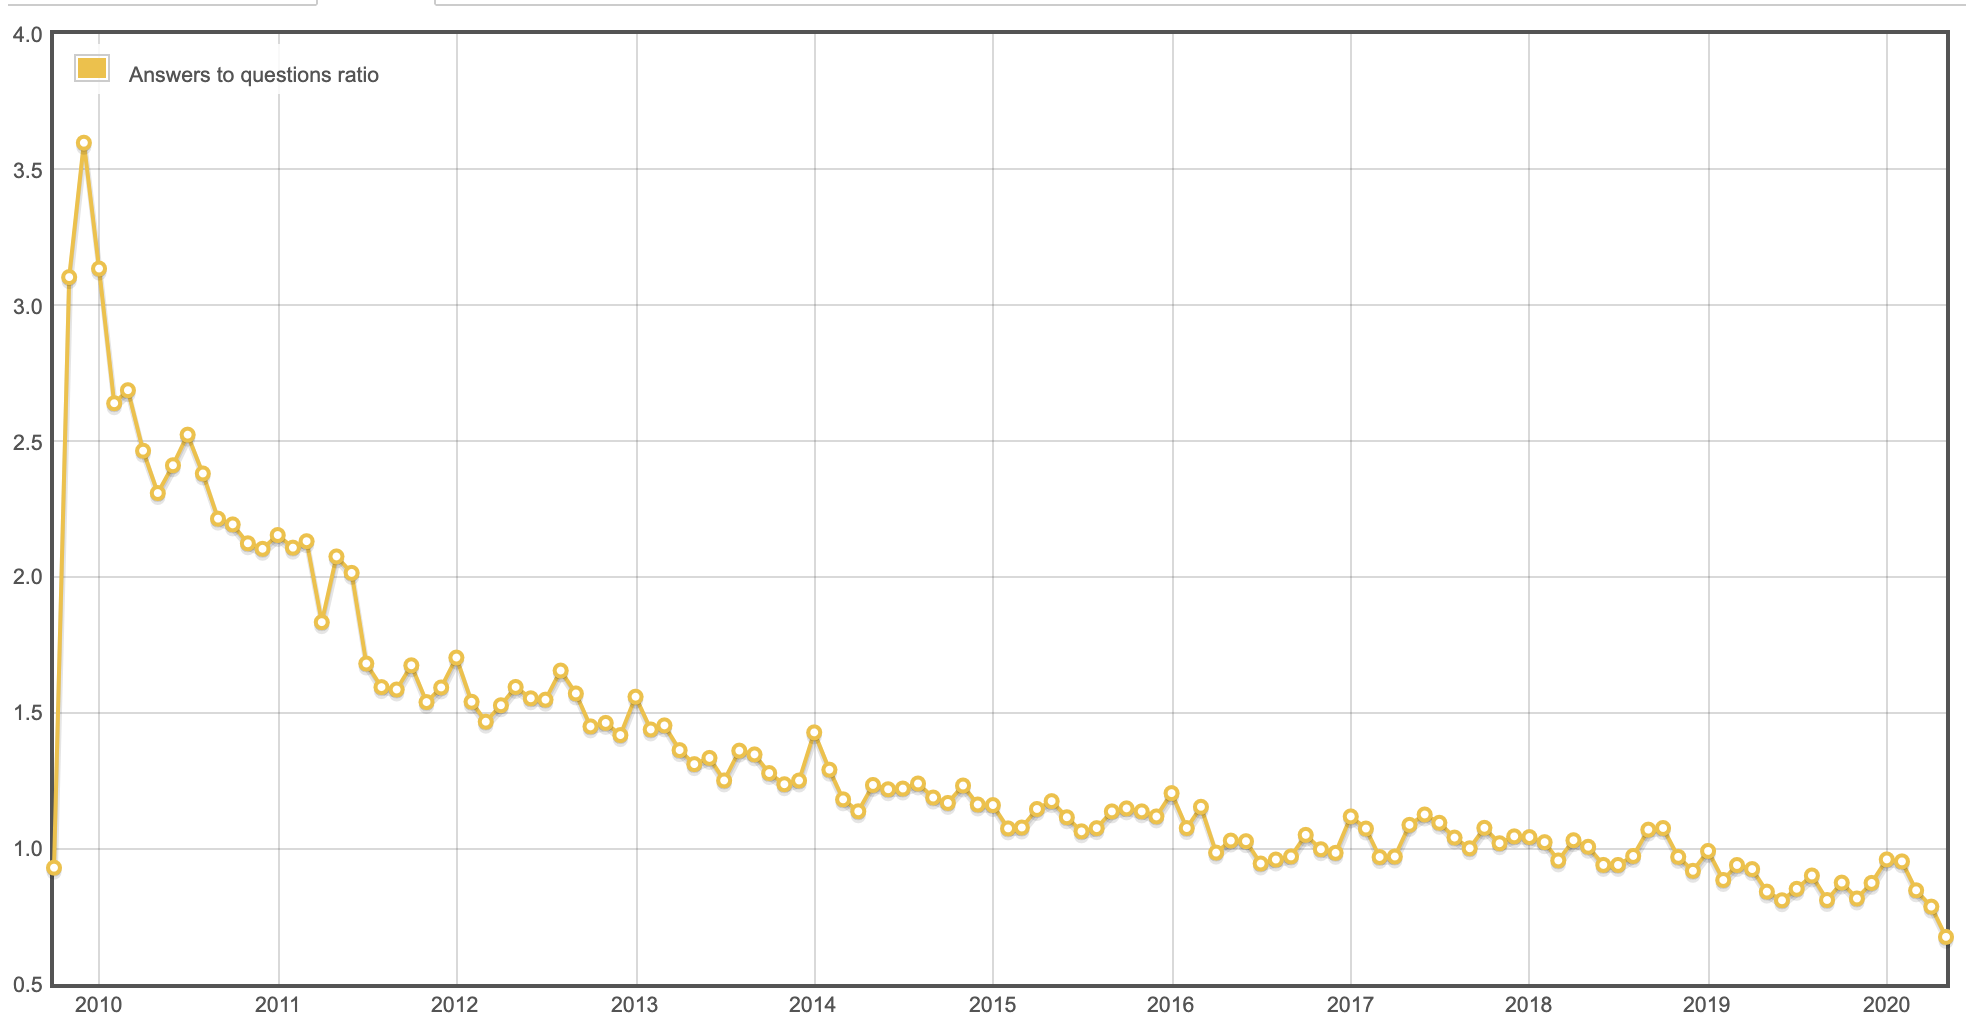
This was caused by an answer of mine to the question Slight downward trend in Q & A. I was adding another update to that answer when I noticed that the query I was using there now can be run for more extended periods of time. So I tried it and would like to share the resulting graph here since I find it significant.

enter image description here

I believe this graph raises several questions. Seemingly it tells that while the number of questions remains roughly the same, the number of answers keeps dropping over time.

Is there a way to check whether this apparent trend reflects something statistically significant?

To obtain more detailed information, it would be, I think, interesting to measure number of answer upvotes per question, but I do not know enough databasing to do it. Can anybody do that? Or something similar, or even not similar but more informative?

And, well, an overall question - what do you think of it?

$\endgroup$
23
  • 19
    $\begingroup$ I think in the early days, there was a lot of low-hanging fruit for easy picking. $\endgroup$
    – Todd Trimble Mod
    Commented Apr 7, 2020 at 17:25
  • $\begingroup$ Maybe I am doing something wrong in my SEDE queries, but I do not see decrease in number of answers. Here is my SEDE query and a corresponding query including deleted posts. $\endgroup$ Commented Apr 7, 2020 at 17:28
  • 1
    $\begingroup$ Is an explanation what the query linked in the post linked in your query calculates available somewhere? What parameters did you use to get the graph in your post? $\endgroup$ Commented Apr 7, 2020 at 17:29
  • 1
    $\begingroup$ And I believe the queries you link to here show roughly similar picture, don't they? Also, could you explain more about deleted posts? $\endgroup$ Commented Apr 7, 2020 at 17:36
  • 2
    $\begingroup$ @ToddTrimble maybe; still the fact is that there were always more answers than questions before 2016; while, after mid-2018, there are always more questions than answers. $\endgroup$ Commented Apr 7, 2020 at 17:38
  • 1
    $\begingroup$ It is possible to link to a query including parameters filled out, for example in your link I can add period=91 and points=40. I suppose this would help others to see better what you're actually doing. (Since they would see not only the picture include in your post, but also how you obtained the graph.) $\endgroup$ Commented Apr 7, 2020 at 18:31
  • 1
    $\begingroup$ @MartinSleziak For a question $q$ let $f(q)$ be the total number of upvotes that all answers to this question get (probably including negative numbers for downvotes). Then what I meant was the mean of the numbers $f(q)$ for all $q$ in a given time block. But I am not at all sure this is a meaningful thing to look at, this is just the only refinement that came to my mind. $\endgroup$ Commented Apr 10, 2020 at 11:38
  • 1
    $\begingroup$ Unless I made some mistakes, this query should return $f(q)$ for each question, and this query should be average score of answers depending on the month when the question was posted. (This only takes into account the date when the question was posted, not when answers were posted, but usually these dates are near to each other.) $\endgroup$ Commented Apr 10, 2020 at 12:17
  • 1
    $\begingroup$ Could you please add this to your answer? Another simpler and probably also useful thing to look at would be a query like this but just with $f(q)=$ the number of answers to $q$. This should drop in any case since recent questions are unanswered yet, but will probably show something about dynamics $\endgroup$ Commented Apr 10, 2020 at 12:23
  • 1
    $\begingroup$ Maybe it is worth reminding that people with sufficient reputation (and moderators) have access to site analytics, where they can also see some stats about activity on the site. $\endgroup$ Commented Apr 11, 2020 at 7:56
  • 1
    $\begingroup$ As a side note perhaps (answers) would be a suitable tag for this post. (Since you're mainly interested in the statistics for answers.) $\endgroup$ Commented Apr 11, 2020 at 9:59
  • 3
    $\begingroup$ Could big-list questions possibly contribute a significant amount to this effect? There were a lot of those in the early days, I believe. $\endgroup$
    – Will Sawin
    Commented Apr 13, 2020 at 1:34
  • 1
    $\begingroup$ @Will although not every big-list question gets a lot of answers, e.g., mathoverflow.net/questions/348992/… and mathoverflow.net/questions/345263/… and mathoverflow.net/questions/343943/… and mathoverflow.net/questions/341954/… and mathoverflow.net/questions/339005/… .... $\endgroup$ Commented Apr 13, 2020 at 11:58
  • 1
    $\begingroup$ @WillSawin I have tried to add some queries which should make the effect of big-list questions lower. (Namely queries looking only at non-CW posts/questions, and queries omitting questions with some specific tags.) $\endgroup$ Commented Apr 13, 2020 at 12:50
  • 1
    $\begingroup$ @მამუკაჯიბლაძე I have edited the queries a bit. (I hope I did not leave any mistakes.) The results with omitting these two tags look now rather similar to each other. $\endgroup$ Commented Apr 14, 2020 at 5:24

3 Answers 3

7
$\begingroup$

I do not really have an answer, but let me at least provide some further SEDE queries, so that we have more data. (I only know very basics of SQL, but I hope that somebody more knowledgeable might have a look and spot if I made some mistakes in the queries. I have checked at least some of the numbers here in chat.)

I have linked to queries for MO below, you can switch to other sites if you want to compare the statistics.

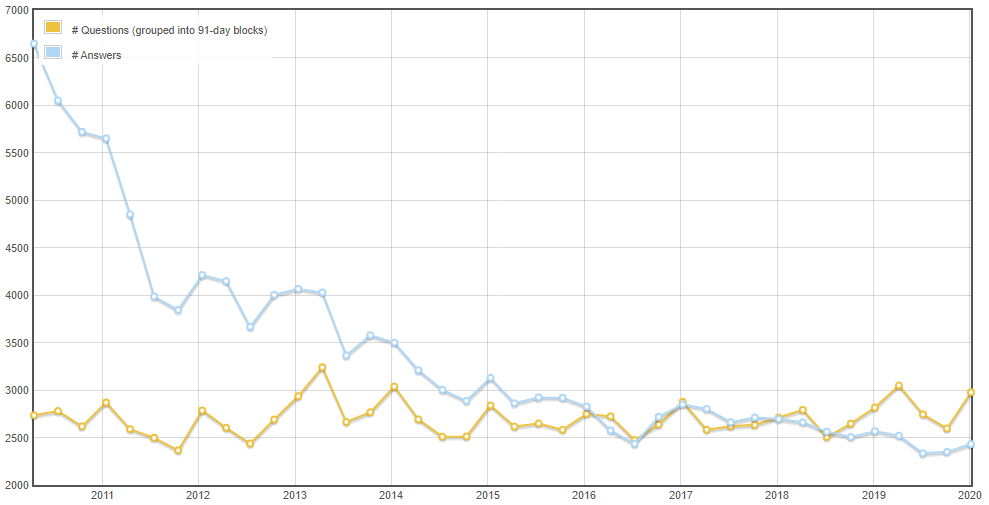
For the sake of simplicity, I am grouping the data by month. (In this way we're comparing months with different number of days, but probably this difference is not that significant, especially considering some seasonal changes such as Christmas or academic year which might have bigger effect.) Here is the number of questions/answers/all posts per month (and a corresponding query which includes deleted posts).

We can compare this with other statistics about the site:

  • We can look at the ratio of answers posted to questions posted (and the same query including deleted posts).
  • We can compare this with number of active users. Since number of users who visited the site is not available in SEDE, we can try to use users who made at least one post or users who made at least one comment as a proxy. Depending on which of the two measures we take, we get this number of posts/questions/answers per active user: query 1 - posts, query 2 - comments.
  • Another statistical datapoint available is number of views of the questions. It is expected that older questions have more views, since they had more time to accumulate them, here is the corresponding graph. We can ask how the number of answers per one view evolves depending on the age of the question, we get this query. (Although it is probably expected that after certain time the questions are more likely to get new views than new answers, so the data from here do not have a straightforward interpretation.)
  • This query returns average answerscount (depending on the age of the question).
  • If we are looking at number of answers, perhaps also number of unanswered questions (=questions with no answers) might be of interest. Here is number and percentage of such questions depending on month when the question was posted.

In the question (and the comments here and here) it was suggested that we could measure also number of answers and total score of all answers combined.

  • In this query you can see how numbers of upvotes cast on questions/answers/all posts evolves over time. (This query takes into consideration the date when the vote was cast, rather than the date when the question was posted.)
  • Here is a query which calculates average "total score of all answers" (i.e., sum all scores of the answers) depending on month when the question was posted. (In case this "total answer score" seems interesting to you, here is a query that can be used to get it for individual questions.

It was pointed out by Will Sawin that at the beginnings of MO there were more big-list questions, which might influence the number of answers. We might check for these by looking at some specific tags, or by taking into account only non-CW posts. (Originally I used in tag-related queries simply the AnswerCount, which meant that an answer was counted in the month when the question was posted. I reworked the queries since then, in the queries where this is applicable the answers should be counted based on the date when the answer was posted.)

Probably at least in some of the queries above some changes over time are to be expected - for example, older questions (and their answers) had longer time for getting upvotes, views, etc.

$\endgroup$
12
  • 1
    $\begingroup$ Thanks a lot for your work. Although not giving anything definitive, your answer made me think of the following: if we only know that the number of questions remains roughly the same, I believe this almost necessarily implies that the number of answers must drop. This is because each question needs certain time to be answered, so the number of unanswered questions must accumulate over time. This is most clearly shown in your graph for the ratio answers/questions $\endgroup$ Commented Apr 10, 2020 at 11:52
  • 1
    $\begingroup$ @მამუკაჯიბლაძე. So it might be interesting to see the growth of the number of unanswered questions over time, to judge if that is sufficient to explain the drop in the A/Q ratio. $\endgroup$ Commented Apr 10, 2020 at 13:00
  • 2
    $\begingroup$ @JosephO'Rourke I have added the queries showing number and percentage of questions with zero answers. (I counted the question with no answers, although the phrase unanswered question is also used in different meanings.) $\endgroup$ Commented Apr 10, 2020 at 13:25
  • $\begingroup$ Another thing that is, I believe, very important and that I noticed only now. The number of views per question seems to drop even more noticeably than the number of answers; and moreover number of answers per view actually seems to grow! So it might well be that the actual reason behind the drop of the number of answers is the drop of the number of views? $\endgroup$ Commented Apr 10, 2020 at 14:05
  • $\begingroup$ I am going to accept this one. Although this is not really an answer, it amply provides what the question requests - additional information to contemplate. $\endgroup$ Commented Apr 10, 2020 at 14:12
  • 1
    $\begingroup$ @მამუკაჯიბლაძე Re: So it might well be ... drop of the number of views? This is hard to say. One would expect that question gets some views from the frontpage, some views from Google searches and various external sources. While the first category contributes to views mostly soon after the posting, the contribution of the second category should be more-or-less steady. So it is expected that older posts have more views. $\endgroup$ Commented Apr 10, 2020 at 14:19
  • $\begingroup$ Have to agree. Still, I find it highly significant if the number of answers per view indeed grows. $\endgroup$ Commented Apr 10, 2020 at 14:25
  • $\begingroup$ Concerning your plots of unanswered questions (thanks!): How can the # of unanswered questions drop by ~100 in one month? E.g., from 403 to 291 around Apr 2017? Surely that many were not suddenly answered. $\endgroup$ Commented Apr 10, 2020 at 15:05
  • 1
    $\begingroup$ @JosephO'Rourke Just to clarify, it is number of questions which were posted in a given month. Assuming that I did not make mistake when creating the queries, those number say that 403 out of the questions posted in March 2017 are still without an answer, 291 of the questions posted in April 2017 are still without an answer. (So these stats concern two disjoint sets of questions, one for every month.) $\endgroup$ Commented Apr 10, 2020 at 15:14
  • 1
    $\begingroup$ Since we're talking about unanswered questions, I will stress that those numbers show questions which do not have answer now. If we looked at the total number of unanswered questions at a given time, that is most likely going to be increasing. At least it seems be the case for Mathematics Stack Exchange where those numbers are tracked. (With the exception of occasional drops caused by clean-up scripts.) $\endgroup$ Commented Apr 10, 2020 at 15:50
  • $\begingroup$ With big list and soft question excluded the answers to recent question ratio is 1.26. With them included it's .70. Doesn't this imply that at least 1 -.7/1.26 = 44% of recent questions are soft questions or big lists? $\endgroup$
    – Will Sawin
    Commented Apr 13, 2020 at 13:54
  • $\begingroup$ @WillSawin That query indeed looks suspicious - I have edited it a bit to calculate the ratio in a different way. (Certainly, it is expected that this ratio is lower if we remove these two tags.) I'll try to check the queries again a bit later. I will repeat the explanation which I gave in the post - in the queries based on tags I am looking at the creation date of the question. (So the answer posted in April can contribute to number in the previous months, it is posted on an older question.) $\endgroup$ Commented Apr 13, 2020 at 14:26
3
$\begingroup$

Just for ease of reference, here is @MartinSleziak's graph of answers/questions:


          Ratio of answers posted to questions posted.


$\endgroup$
2
$\begingroup$

If this reflects all questions asked, I am then unsurprised. I think the query should be changed to reflect only answered questions plus those questions which are unanswered but not closed. There are many questions asked which are closed as off topic, and which go unanswered. If you eliminate those, you may find a different story.

Gerhard "We're Not Even Talking Duplicates" Paseman, 2020.04.07.

$\endgroup$
4

You must log in to answer this question.

Not the answer you're looking for? Browse other questions tagged .