3
$\begingroup$

I check the review queues several times a day, each day. I have noticed a significant drop of posts in the queues that I am watching (First questions, First answers, LQP, Late answers). Even the statistics associated to each queue seem to confirm this. Anyway, this impression is entirely subjective. Could anyone with a bird's view over the whole MO community (i.e. access to numbers and SEDE queries) confirm whether this is indeed real (i.e. fewer questions, fewer answers, fewer edits, fewer new users etc.)? It seems to me that reading the war news and commentaries has absorbed the attention of many (at least this is what I do for most of each day), with less time dedicated to mathematics as a consequence, and I want to check this conjecture.

(I can't find any relevant tag for this question other than "discussion".)

$\endgroup$
3
  • 5
    $\begingroup$ You asked for users with "access to numbers and SEDE queries". I will just point out that every user can run SEDE queries. (The only question is what kind of query you'd linke to see. Number of post per day, per week? Something else?) 20k+ users (and moderators) have access to site analytics. $\endgroup$ Commented Feb 28, 2022 at 13:58
  • 3
    $\begingroup$ Yesterday (i.e. 27th of February) only 40 posts were made, which seems to be the lowest number since December 25, 2020. $\endgroup$
    – Stefan Kohl Mod
    Commented Feb 28, 2022 at 14:39
  • $\begingroup$ I will add that maybe some of the queries posted here might give you some of the data your interested in: Does the number of answers really drop over years? (They are among the queries mentioned in chat - although I probably failed to mentioned that a few of them were from that post.) $\endgroup$ Commented Mar 5, 2022 at 7:27

3 Answers 3

5
$\begingroup$

Yes. Weekly analytics show a clear drop in posts and votes since the week when the war started:

Graph of posts

Graph of votes

$\endgroup$
4
  • 2
    $\begingroup$ Hmm, now the difficulty is to understand how your answer and Asaf Karagila's one can be correct at the same time... $\endgroup$
    – Alex M.
    Commented Mar 8, 2022 at 13:40
  • 1
    $\begingroup$ I think the problem is that daily traffic semi-regularly fluctuates a lot during the week, and this makes it difficult to eye-ball the general trend as Asaf attempted to do. $\endgroup$ Commented Mar 8, 2022 at 14:01
  • $\begingroup$ Could you please post, as a comment or as an edit of your answer, the query (or a link to it) that produced those graphs? I would like to play with it (and its parameters) a bit in the following weeks. Thank you. $\endgroup$
    – Alex M.
    Commented Mar 10, 2022 at 19:26
  • 1
    $\begingroup$ I didn’t use any query. The graph is straight from mathoverflow.net/site-analytics (requires 25K reputation, see mathoverflow.net/help/privileges/site-analytics). $\endgroup$ Commented Mar 10, 2022 at 19:56
5
$\begingroup$

To complement the answers already posted, here are some SEDE queries. (SEDE queries have the advantage that they can be run by any user - and they also can be easily run on other sites. And also if we run those queries at some future date, we get an updated information. On the other hand, site analytics contain also some information which isn't available SEDE - for example page views or visits. And most of the queries show counts grouped by week - again to make the comparison easier.1)

I should include the usual caveat that SEDE is only updated once a week. You can also notice that it is possible to change the parameters with start and end date in the queries below. (I have chosen the startpoint in November - so that it is easier to compare the graphs with the ones that have already been posted.)

Here are some examples of queries which could (very roughly) correspond to some measure of activity on a Stack Exchange site.

Number of posts

Specifically, if we look at the first query - with the number of posts - we get the following graph. (I have posted graphs in such way that they are cut off at the end of the week - in the previous version, I included graph where the most recent datapoint counted only one day of a week - which might seem a bit misleading without an additional explanation. It would probably be good to update the pictures a few weeks later - to see how the trends change after that. EDIT: Both graphs are now updated to show what the situation looks like at the end of April. And of course, you can run the same queries at any point in the future - do not forget to change the parameters of the queries if you want to see the results over a longer period.)
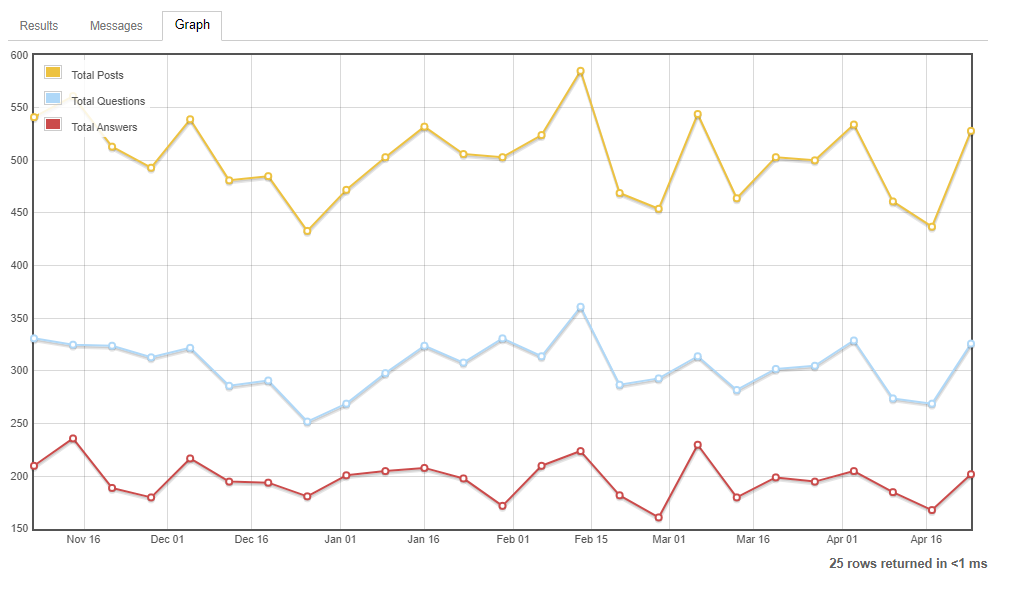
Graph after the end of April

We can also run a similar query counting posts in the whole network. This is what it looks like at the moment:
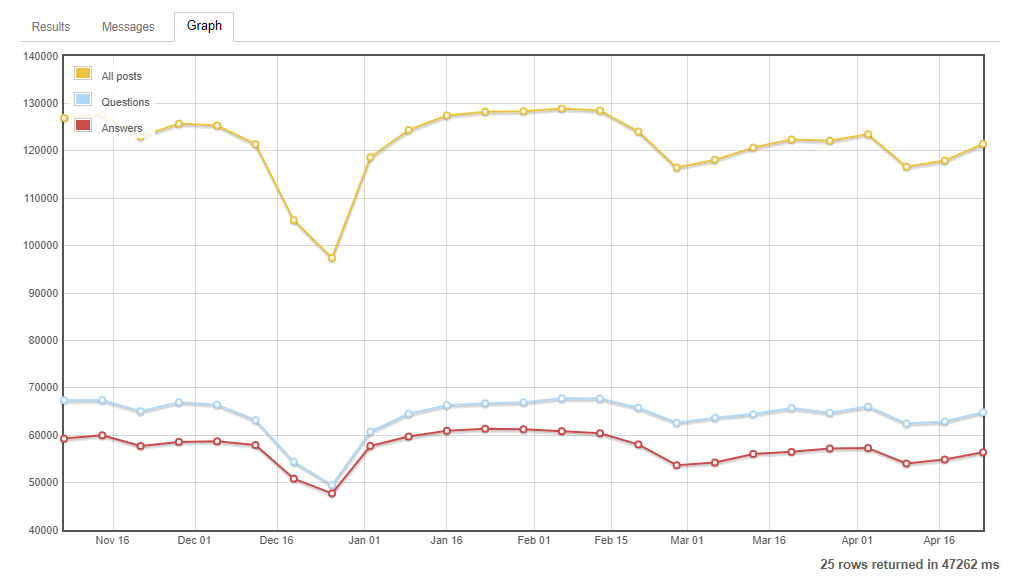
Networkwide graph after the end of April

We can also check how the similar stats evolves on some other sites - for example, StackOverflow Mathematics, Physics, Computer Science or Academia. (Of course, if a site has generally low activity, random fluctuations can be significant enough to overshadow some general trends. For example, you can try Math Educators or this meta.) Of course, there are sites where you'd expect increase of posts, such as Politics or Skeptics, perhaps even sites such as Law or History.

1To get the beginning of the week, I followed this answer on Stack Overflow: Get the week start date and week end date from week number

$\endgroup$
1
4
$\begingroup$

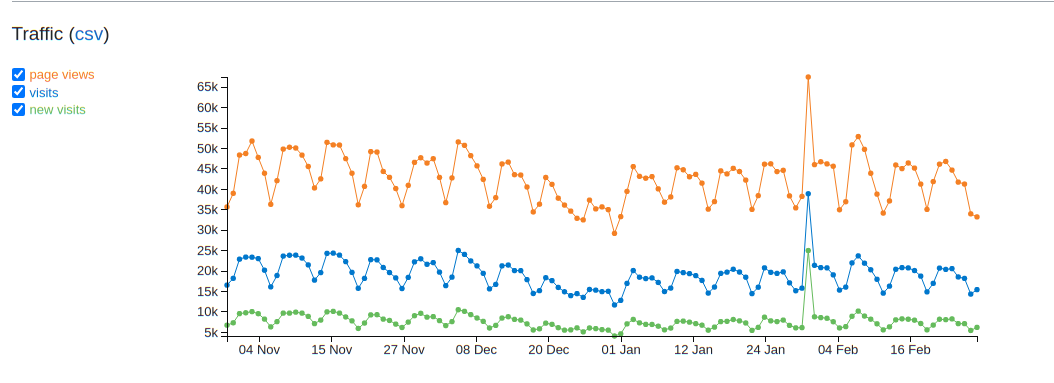
No. From a bird's eye view on the analytics, going from 1/1 until 27/2, there were one very unusual peak on the 31st of January, and a slightly higher than average (but not significant enough) increase on 7th of February.

Other than this, it looks like business as usual in the "number of visitors" and "total page views" graphs. The above data was taken from the moderator analytic tools.

Screenshot from the "more public" 20k user tools:

Traffic graph

$\endgroup$
2
  • 4
    $\begingroup$ What happened on January 31? $\endgroup$ Commented Feb 28, 2022 at 15:14
  • 2
    $\begingroup$ I don't know. mathoverflow.net/questions/412762/… probably accounts for a large chunk of the views, but that's a lot less than even the "new visits" count. $\endgroup$
    – Asaf Karagila Mod
    Commented Feb 28, 2022 at 16:08

You must log in to answer this question.

Not the answer you're looking for? Browse other questions tagged .