8
$\begingroup$

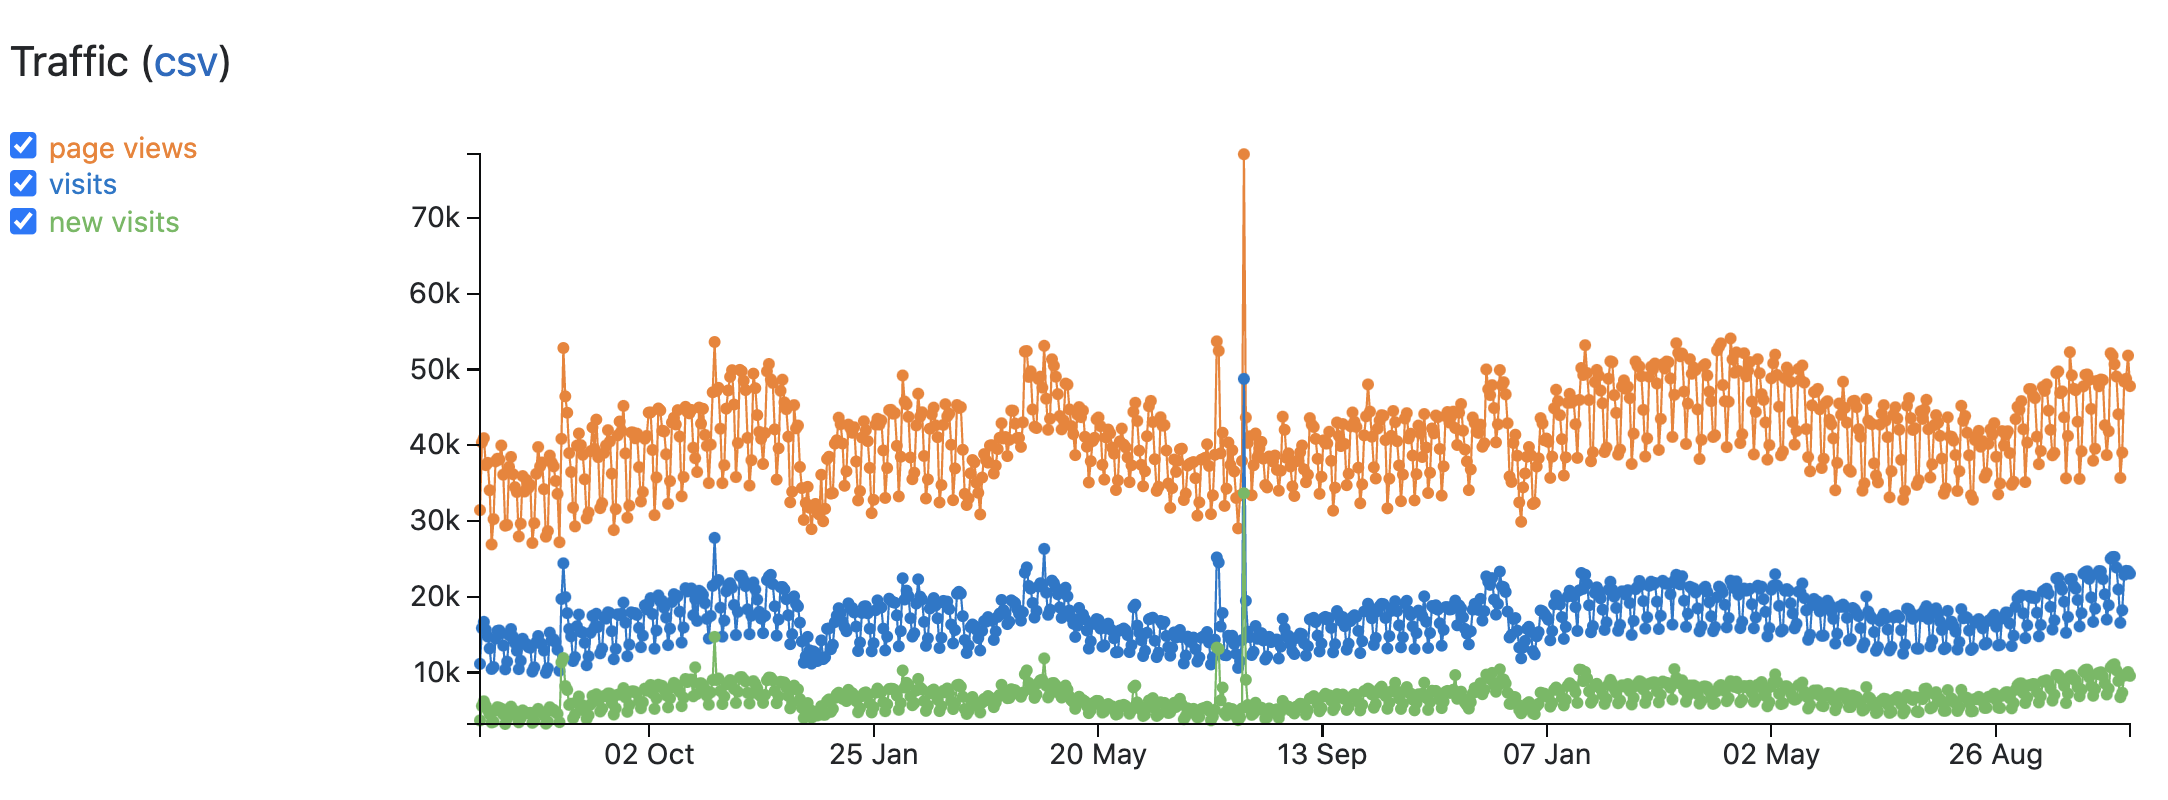
The MathOverflow traffic (page views, visits, new visits) shows steady and possibly increasing activity over the last $2+$ yrs. The chart below runs from 2019-Jul-07 on the left and 2021-Nov-04 on the right. More than $2\frac{1}{4}$ years. One can see predictable seasonal variations—diminished activity near Christmas, a trough in the summers.

Two points:

  • I would think that MO activity would decrease over the years, as more and more fundamental questions get asked and answered. But that does not seem to be the case. If anything, traffic is (slowly) increasing.
  • Something happened around 3Aug2020.

I'd appreciate any comments/speculations that explain these two observations.

TrafficChart

$\endgroup$
9
  • 8
    $\begingroup$ I think the hypothesis that MO is used to answer fundamental questions may not be a natural one. To the extent that it is, I think MO users, me among them, are so eager to ask their neat questions that they aren't very thorough about checking for duplicates, so that lots of fundamental questions get repeatedly re-asked. $\endgroup$
    – LSpice
    Commented Nov 6, 2021 at 1:25
  • 17
    $\begingroup$ Why should questions connected to research decrease over time? The research output of mathematicians seems to be going up, overall. $\endgroup$
    – David Roberts Mod
    Commented Nov 6, 2021 at 2:10
  • 2
    $\begingroup$ Maybe (statistics) could be a suitable tag here? $\endgroup$ Commented Nov 6, 2021 at 6:05
  • 2
    $\begingroup$ You write "Two questions". But there is no question below. $\endgroup$
    – YCor
    Commented Nov 6, 2021 at 7:45
  • $\begingroup$ @YCor: The two questions are to explain the slight rise, and the anomaly in August 2020. $\endgroup$ Commented Nov 6, 2021 at 10:37
  • 1
    $\begingroup$ I sort of guess this is what you want to ask. But these are not formulated as questions. $\endgroup$
    – YCor
    Commented Nov 6, 2021 at 11:27
  • 1
    $\begingroup$ @YCor: Revised to make it clearer. Thanks. $\endgroup$ Commented Nov 6, 2021 at 12:22
  • 1
    $\begingroup$ Big spikes should be: questions mentioned elsewhere. $\endgroup$ Commented Nov 6, 2021 at 15:58
  • 2
    $\begingroup$ Note that summers occur around January/February in the Southern Hemisphere - not sure how many Southern Hemisphere users or visitors we have here though. $\endgroup$
    – J W
    Commented Nov 11, 2021 at 14:19

1 Answer 1

11
$\begingroup$

Is it possible that the question "Issue UPDATE: in graph theory, different definitions of edge crossing numbers - impact on applications?" might be partly responsible for the peak?

If we notice a smaller peak a few days before that, that one might perhaps be connected with the question "What are the benefits of writing vector inner products as $\langle u, v\rangle$ as opposed to $u^T v$?". It had 8k views on July 21 and 43k views on July 24.

Notice that from SEDE we can get ViewCount for each question - we see CreationDate of that question, but we do not know how the views were distributed over time. Some related queries; Sum of ViewCount per day, Top viewed question per day.

On MO there are 18 questions with 100k+ views and 23 questions with 90k+ views. Here is a SEDE query showing question with the most views. I would not be surprised if you found at least some peaks in activity near other highly viewed questions. You could also check other highly voted reddit posts related to MO to see whether they lead to highly viewed questions and whether you can find some peaks in the traffic near them. (This particular reddit thread is shown as the top in the linked search, with score 2.2k.)

I would guess that it depends a bit on the size of the site and on the total number of questions per day whether a single question can significantly change the statistics for the whole site. Here are some stats from 2020 for MO. If you look at the percentage of views contributed by the top question, on MO it was in 2020 quite often above 50%. If you compare this with Mathematics in 2020, you never see a number above 30%.

$\endgroup$
4
  • 2
    $\begingroup$ Oh, good catch on that question that was posted to Reddit. I remember that question, and it's exactly the sort of quasi-clickbait that gets people excited. $\endgroup$
    – David Roberts Mod
    Commented Nov 7, 2021 at 14:44
  • $\begingroup$ A commenter points out that it was also linked on HackerNews on Aug 4, which would have driven a lot of traffic here. There are 653 upvotes on that post on HN, and 127 comments. $\endgroup$
    – David Roberts Mod
    Commented Nov 7, 2021 at 14:46
  • 4
    $\begingroup$ HackerNews is the equal-sixth-highest referring site for MathOverflow in the past month, if that gives any context to how much traffic we get from there without spikes. All the higher-listed sites are MO itself or stackexchange sites. Overall, new visits went up by a factor about 6 on Aug 4th 2020 compared to the previous day, and total page visits more than doubled. $\endgroup$
    – David Roberts Mod
    Commented Nov 7, 2021 at 14:58
  • 1
    $\begingroup$ And note the Reddit post has net 2181 upvotes, which is very high for r/math, so it got a lot of attention. $\endgroup$
    – David Roberts Mod
    Commented Nov 7, 2021 at 15:03

You must log in to answer this question.

Not the answer you're looking for? Browse other questions tagged .