This answer is community wiki - feel free to edit it if you have some useful information to add.
In case somebody wants to have a look at some stats about spam - for example to compare the current situation with the situation in the past - you can have a look at metasmoke or you could use SEDE.
Some basic information about Charcoal, SmokeDetector and related projects: https://charcoal-se.org/
In metasmoke you can find various stats and details about posts which were caught by SmokeDetector or reported manually. (So this isn't necessarily the same as the list of post which have actually been flagged as spam.)
You can find the list of posts on MathOverflow and MathOverflow Meta. If you look at details of some posts, if there is a small red flag on the top left, you can find logs of flags by Charcoal users. Here is an example of a flag log. (It is certainly valuable that volunteers from the Charcoal project help with removing spams on various sites in this network, including MathOverflow.)
In SEDE, one can find spam flags in the Votes table, using VoteTypeId=12 - which denotes spam. There is also VoteTypeId=4 meaning offensive. In some of the queries below you can change parameters to switch the parameters deciding which VoteTypeId is used.)
You should keep in mind that SEDE is updated only once a week (on Sunday) - so the stats shown here do now count the most recent posts.
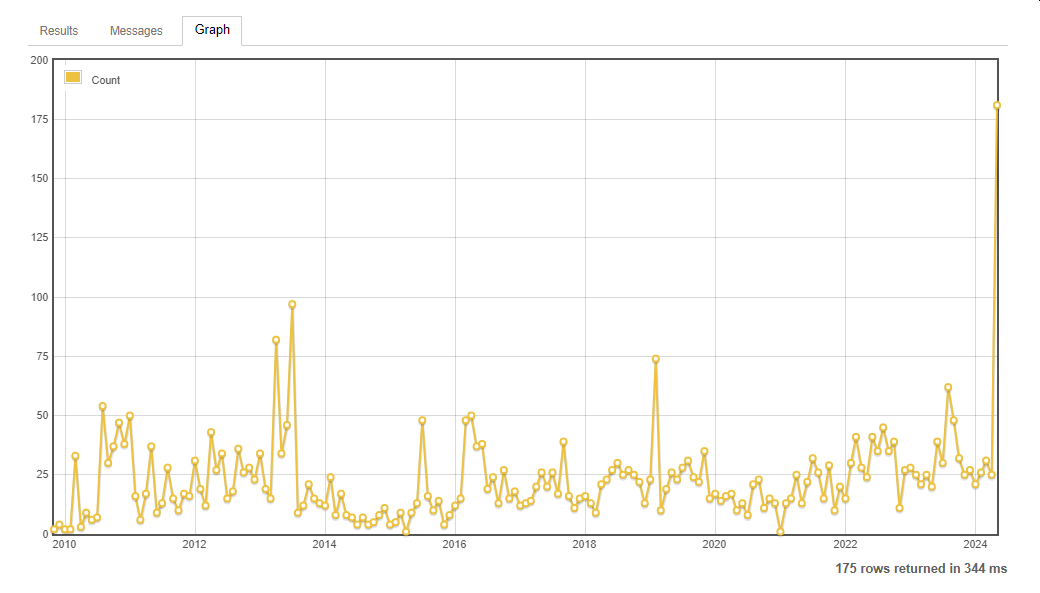
- Number of spam posts per month: main and meta.
- Number of spam posts (questions, answers) per year: main, meta.
- Number of spam posts per day: main, meta. (You can change the parameters if you want to see a different date range.)
- List of the posts flagged as spam between the two given dates: main, meta. (These queries return the links too - but only the users who can view the deleted posts will actually be able to get to the content of those posts, too.)
For example, from those queries we get 181 spam posts in April 2024, which is so far the highest number.


