Became Hot Meta Post
added 33 characters in body
Source Link
Joseph O'Rourke
  • 150.8k
  • 33
  • 49

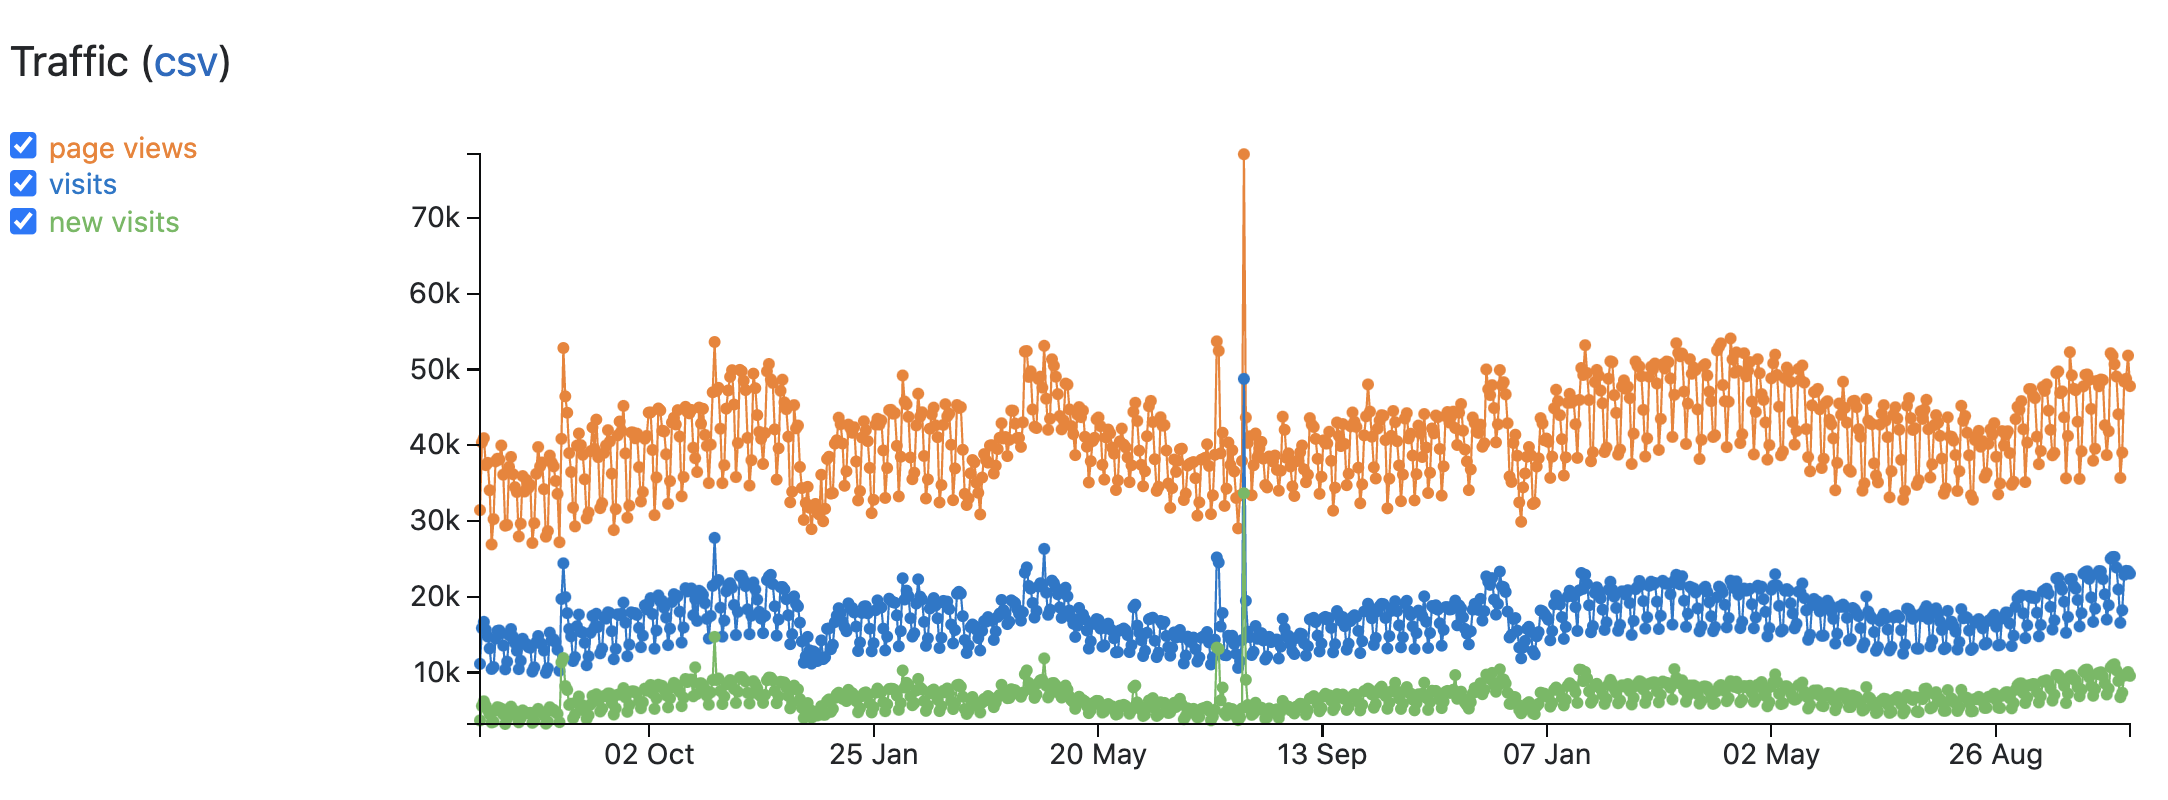
The MathOverflow traffic (page views, visits, new visits) shows steady and possibly increasing activity over the last $2+$ yrs. The chart below runs from 2019-Jul-07 on the left and 2021-Nov-04 on the right. More than $2\frac{1}{4}$ years. One can see predictable seasonal variations—diminished activity near Christmas, a trough in the summers.

Two questionspoints:

  • I would think that MO activity would decrease over the years, as more and more fundamental questions get asked and answered. But that does not seem to be the case. If anything, traffic is (slowly) increasing.
  • Something happened around 3Aug2020.

I'd appreciate any comments/speculations that explain these two observations.

TrafficChart

The MathOverflow traffic (page views, visits, new visits) shows steady and possibly increasing activity over the last $2+$ yrs. The chart below runs from 2019-Jul-07 on the left and 2021-Nov-04 on the right. More than $2\frac{1}{4}$ years. One can see predictable seasonal variations—diminished activity near Christmas, a trough in the summers.

Two questions:

  • I would think that MO activity would decrease over the years, as more and more fundamental questions get asked and answered. But that does not seem to be the case. If anything, traffic is (slowly) increasing.
  • Something happened around 3Aug2020.

I'd appreciate any comments/speculations.

TrafficChart

The MathOverflow traffic (page views, visits, new visits) shows steady and possibly increasing activity over the last $2+$ yrs. The chart below runs from 2019-Jul-07 on the left and 2021-Nov-04 on the right. More than $2\frac{1}{4}$ years. One can see predictable seasonal variations—diminished activity near Christmas, a trough in the summers.

Two points:

  • I would think that MO activity would decrease over the years, as more and more fundamental questions get asked and answered. But that does not seem to be the case. If anything, traffic is (slowly) increasing.
  • Something happened around 3Aug2020.

I'd appreciate any comments/speculations that explain these two observations.
TrafficChart

edited tags
Link
Joseph O'Rourke
  • 150.8k
  • 33
  • 49
added 5 characters in body
Source Link
Joseph O'Rourke
  • 150.8k
  • 33
  • 49

The MathOverflow traffic (viewspage views, visits, new visits) shows steady and possibly increasing activity over the last $2+$ yrs. The chart below runs from 2019-Jul-07 on the left and 2021-Nov-04 on the right. More than $2\frac{1}{4}$ years. One can see predictable seasonal variations—diminished activity near Christmas, a trough in the summers.

Two questions:

  • I would think that MO activity would decrease over the years, as more and more fundamental questions get asked and answered. But that does not seem to be the case. If anything, traffic is (slowly) increasing.
  • Something happened around 3Aug2020.

I'd appreciate any comments/speculations.

TrafficChart

The MathOverflow traffic (views, visits, new visits) shows steady and possibly increasing activity over the last $2+$ yrs. The chart below runs from 2019-Jul-07 on the left and 2021-Nov-04 on the right. More than $2\frac{1}{4}$ years. One can see predictable seasonal variations—diminished activity near Christmas, a trough in the summers.

Two questions:

  • I would think that MO activity would decrease over the years, as more and more fundamental questions get asked and answered. But that does not seem to be the case. If anything, traffic is (slowly) increasing.
  • Something happened around 3Aug2020.

I'd appreciate any comments/speculations.

TrafficChart

The MathOverflow traffic (page views, visits, new visits) shows steady and possibly increasing activity over the last $2+$ yrs. The chart below runs from 2019-Jul-07 on the left and 2021-Nov-04 on the right. More than $2\frac{1}{4}$ years. One can see predictable seasonal variations—diminished activity near Christmas, a trough in the summers.

Two questions:

  • I would think that MO activity would decrease over the years, as more and more fundamental questions get asked and answered. But that does not seem to be the case. If anything, traffic is (slowly) increasing.
  • Something happened around 3Aug2020.

I'd appreciate any comments/speculations.

TrafficChart

Source Link
Joseph O'Rourke
  • 150.8k
  • 33
  • 49
Loading