To complement the answers already posted, here are some SEDE queries. (SEDE queries have the advantage that they can be run by any user - and they also can be easily run on other sites. And also if we run those queries at some future date, we get an updated information. On the other hand, site analytics contain also some information which isn't available SEDE - for example page views or visits. And most of the queries show counts grouped by week - again to make the comparison easier.1)
I should include the usual caveat that SEDE is only updated once a week. You can also notice that it is possible to change the parameters with start and end date in the queries below. (I have chosen the startpoint in November - so that it is easier to compare the graphs with the ones that have already been posted.)
Here are some examples of queries which could (very roughly) correspond to some measure of activity on a Stack Exchange site.
- Number of posts/questions/answers per week - including the deleted posts
- If you'd prefer grouping posts by month rather than by week, some of the queries I posted here could be used: Does the number of answers really drop over years? For example, here are the numbers including the deleted posts and excluding them.
- Number of posts/questions/answers per week (Of course, if we exclude deleted posts, the results are skewed a bit in favor of the more recent dates.)
- Number of upvotes/downvotes per week between two dates (and similar stats per month rather than per week)
- Number of edits per week (and here are edits per month)
- Since they were mentioned in the question, let's include also number of new users per week. However, I am not sure this gives any useful information. If we check a larger data range (per week, per month) we see several months in 2021 with lots of new users - compared to that, numbers of new users in other weeks/months are negligible.
Number of posts
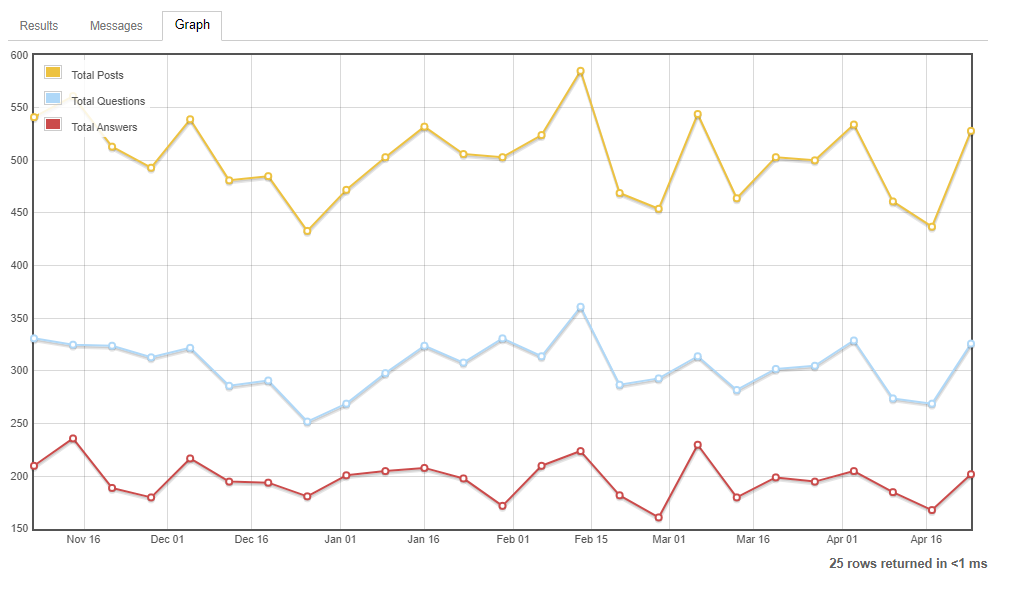
Specifically, if we look at the first query - with the number of posts - we get the following graph. (I have posted graphs in such way that they are cut off at the end of the week - in the previous version, I included graph where the most recent datapoint counted only one day of a week - which might seem a bit misleading without an additional explanation. It would probably be good to update the pictures a few weeks later - to see how the trends change after that. EDIT: Both graphs are now updated to show what the situation looks like at the end of April. And of course, you can run the same queries at any point in the future - do not forget to change the parameters of the queries if you want to see the results over a longer period.)
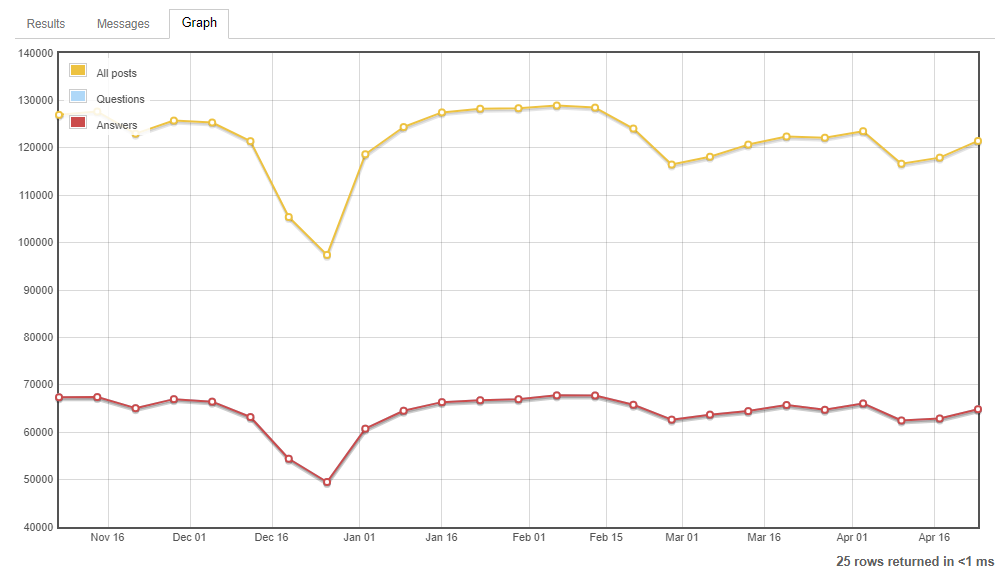
We can also run a similar query counting posts in the whole network. This is what it looks like at the moment:
We can also check how the similar stats evolves on some other sites - for example, StackOverflow Mathematics, Physics, Computer Science or Academia. (Of course, if a site has generally low activity, random fluctuations can be significant enough to overshadow some general trends. For example, you can try Math Educators or this meta.) Of course, there are sites where you'd expect increase of posts, such as Politics or Skeptics, perhaps even sites such as Law or History.
1To get the beginning of the week, I followed this answer on Stack Overflow: Get the week start date and week end date from week number


